Skip to content
Business & SEO

A fast website is good for your users – and for your business

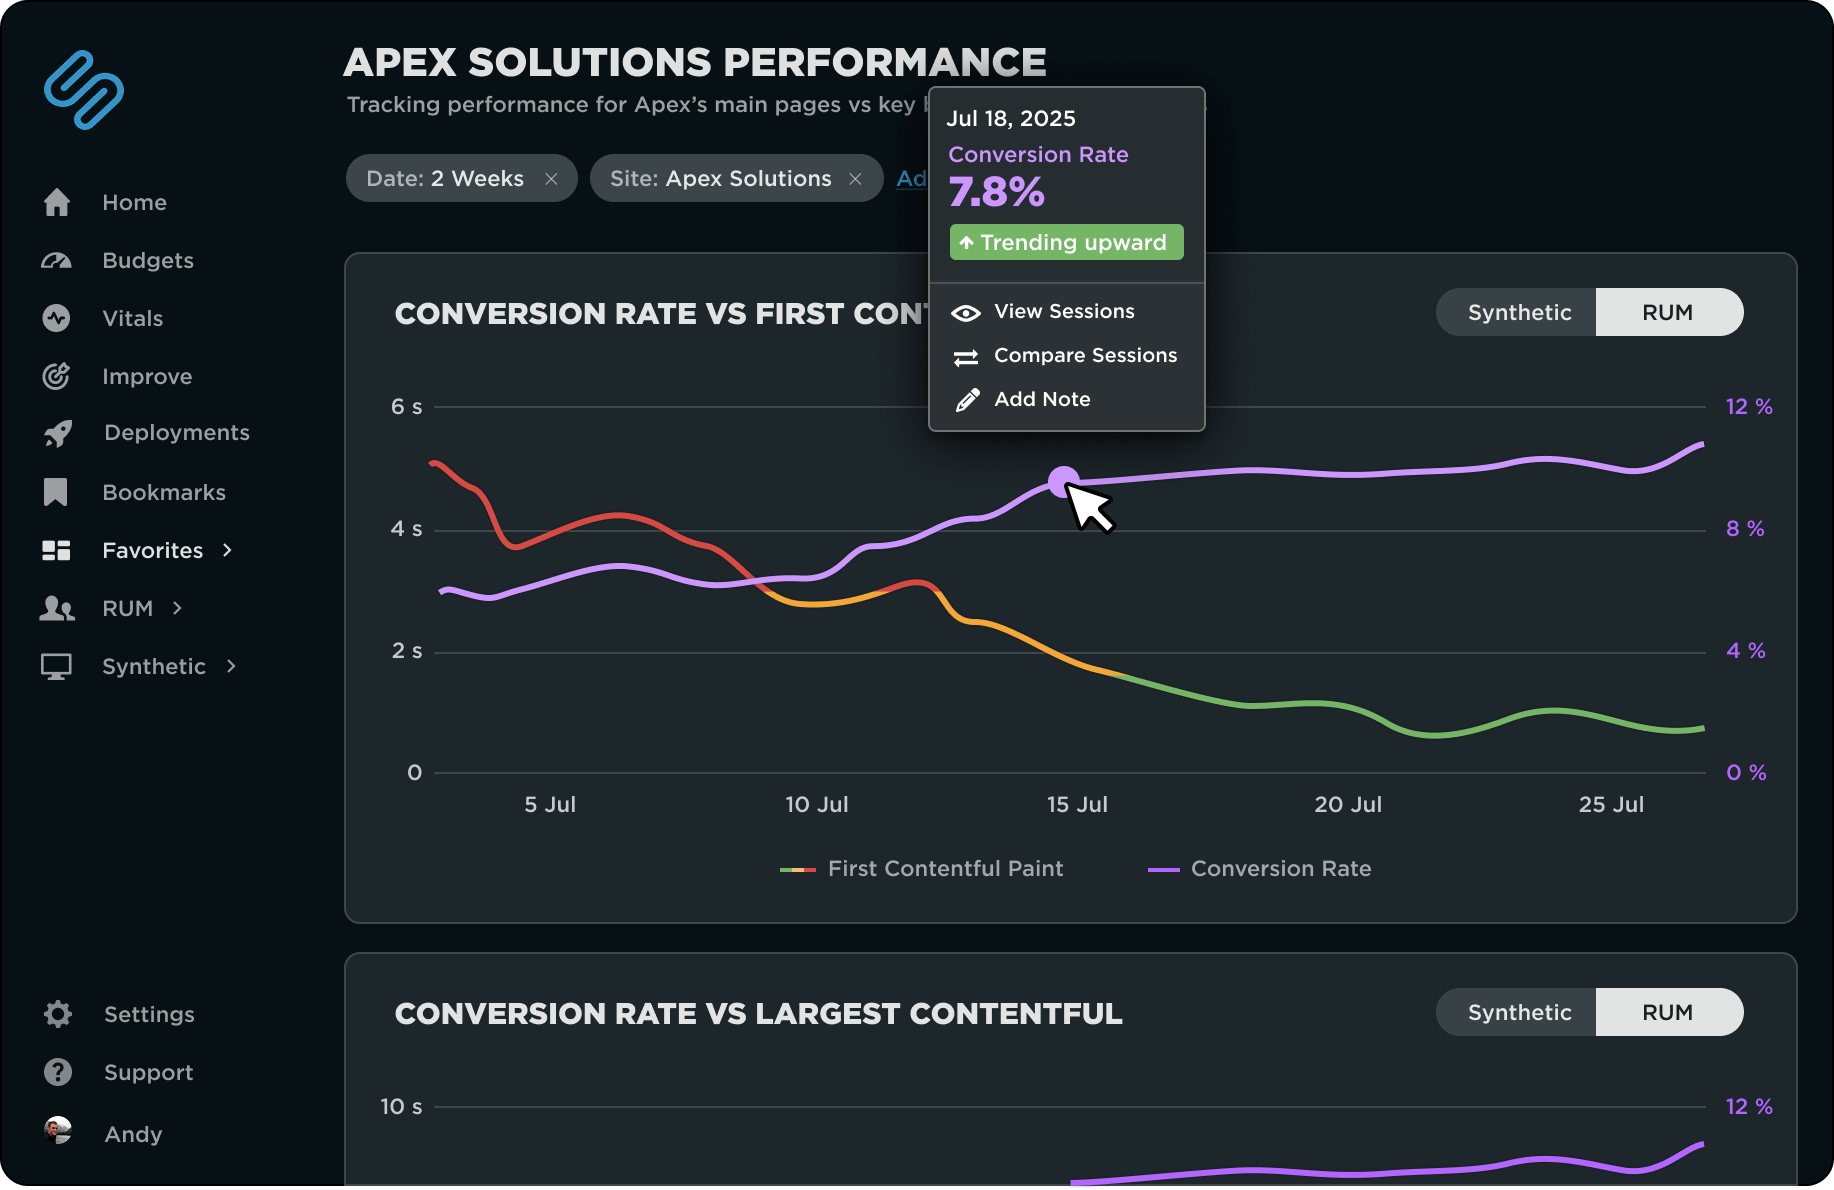
When your site is slow, your business suffers. Slowness affects every metric you care about: bounce rate, conversion rate, customer retention, revenue, and search rank.

SpeedCurve gives you the tools, diagnostics, and insights to improve web performance – and measure the impact on your business.

Easy setup • No credit card required

“We had a third party degrade web performance and got alerted by SpeedCurve. We raised the issue with the third party and they fixed it. Metrics are now back to normal!

Increase conversions and revenue

Improving page speed reduces friction from the user experience—so visitors convert faster and more confidently. Track any business metrics you want – including cart size, bounce rate, and conversion rate – and see how they’re affected by web performance changes.

Web Performance for Retailers

SpeedCurve Business Metrics
Optimize for SEO ranking

Core Web Vitals are a set of user experience metrics that Google factors into its search ranking algorithm. SpeedCurve shows your realtime and historical Core Web Vitals. Your team gets immediate alerts when any of these metrics violate Google’s thresholds, along with diagnostics telling them what needs to be fixed.

Get Started with Core Web Vitals

SpeedCurve Optimise for SEO ranking
Stay faster than your competitors

With ongoing benchmark testing, SpeedCurve lets you compare your site’s performance to others in your industry. Get detailed metrics, side-by-side videos and filmstrips of your competitors to share with your team, so you can spot gaps and stay ahead.

Competitive Benchmarking

SpeedCurve Competitor Benchmarks
Know how happy your users really are

Track user happiness over time. Monitor improvements and get alerts when user happiness degrades so you can quickly get to the root cause of regressions.

User Happiness Score

SpeedCurve User Happiness
Pinpoint inefficiencies and reduce operational costs

Pages with smaller, more efficient assets reduce bandwidth consumption, server load, and reliance on expensive infrastructure. A well-optimized frontend means fewer server requests and lower processing demands, which can delay or even eliminate the need to scale.

Complete Guide to Web Performance Budgets

Understanding Page Bloat

SpeedCurve Browser Waterfall
Web performance monitoring that answers business questions

Capture real-world data from actual users to understand how they experience your site's speed. See how design and development decisions influence performance—and how that performance directly affects your business outcomes.

10% Conversion rate increase
2% Conversion rate increase
15% Signup rate increase
Business & SEO Features

Correlation charts

See the impact of page slowdowns on business KPIs like conversion rate, bounce rate, cart size, and revenue.

Realtime alerts

Get notifications when business-critical regressions happen, delivered to your inbox, Slack, MS Team, or any webhook.

Competitive benchmarks

Competitor leaderboard lets you drill down and see why your competitors are faster than you.

A/B testing

Measure the impact of performance optimizations and other UX experiments on your business metrics.

Custom dashboards

Tailor dashboards to different teams, from executives to developers to SEO teams.

Automated weekly reporting

Easy-to-read reports for different stakeholders, with week-over-week changes delivered to your inbox.

Unlimited user seats and teams

Expand your monitoring and visibility throughout your organization.

Consulting and coaching

Our team of performance experts will help you create an internal culture of web performance and usability.

Case Studies
QuintoAndar
How QuintoAndar increased conversion rates
A project focused on optimizing Core Web Vitals and migrating to Next.js resulted in a 5% increase in conversion rates and a 87% increase in pages per session...
Read Story
Farfetch
Farfetch reduces page load by over a second
Farfetch analyzed more than 1M pageviews and found that conversion rate decreased 2.7% for each additional second of TTI on mobile, and 2.1% on desktop.....
Read Story
Ancestry
How Ancestry shifted to user-centered performance metrics
Ancestry.com saw a 7% increase in conversions after improving render time by 68%, page weight by 46% and load time by 64%...
View Slides
We've helped speed up these websites