Skip to content
Diagnose & Improve

Find out why your site is slow and how to fix it

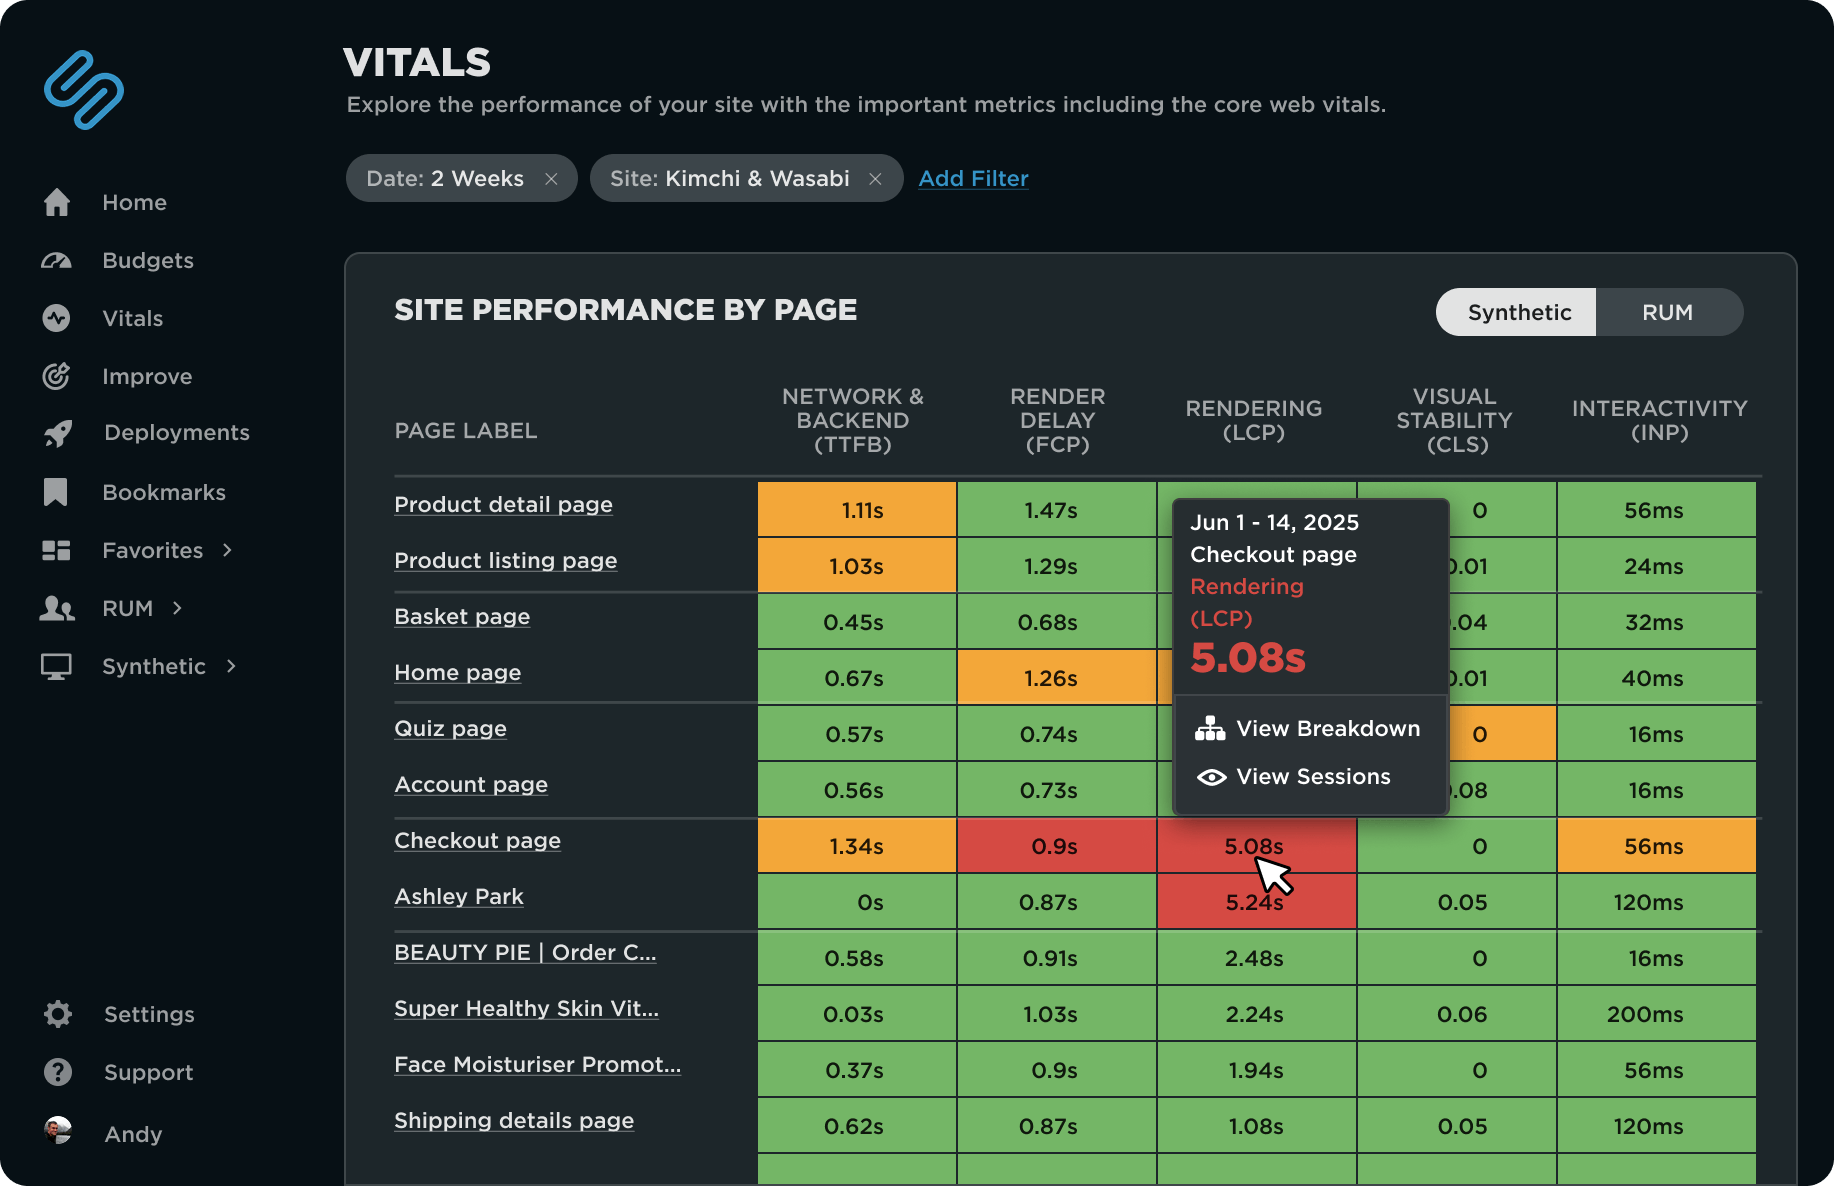
Turn complex performance data into clear, actionable insights. Ship confidently by testing every change in your CI/CD pipeline before it reaches production.

Run Lighthouse audits, monitor real and synthetic performance, and debug issues quickly with detailed waterfalls and side-by-side comparisons. Ship confidently by testing every change in your CI/CD pipeline before it ever reaches production.

Easy setup • No credit card required

“Tried many RUM tools, and SpeedCurve was by far the best. Gives us everything we need – deep diagnostics, compelling visualizations, and shows the business impact of performance.”

Comprehensive monitoring shows you when and where to fix issues

Get a complete view of your site’s performance by combining synthetic and real user monitoring. See how your site performs in the real world with RUM-based field data from actual users. Then dig deeper with lab-based synthetic tests to measure the impact of code changes before and after they go live.

Synthetic and Real User Monitoring

SpeedCurve Real User Monitoring
Performance audits show you what to fix and how to fix it

Whether you're after quick page speed wins or you’re solving complex issues, SpeedCurve audits provide clear, actionable insights that lead to real performance gains.

For deeper analysis, our in-house experts deliver custom audits tailored to your site. We work alongside your team to uncover root causes and guide you through the fixes.

Synthetic vs Real User Monitoring

SpeedCurve Performance Audits
Move from symptoms to root cause — fast

Pinpoint exactly what's slowing down your pages and take action with confidence. Interactive browser waterfalls show how each request affects rendering – making it easy to spot delays to critical metrics like Largest Contentful Paint or long JavaScript tasks caused by third parties.

Side-by-side comparisons highlight exactly what changed between test runs, helping you isolate and fix regressions faster.

Diagnose Issues

SpeedCurve Browser Waterfall
Test before you deploy

Catching performance issues before they go live saves time, protects user experience, and prevents costly regressions. With SpeedCurve, you can seamlessly test the performance impact of code changes as part of your development workflow.

Integrate SpeedCurve into your CI/CD pipeline to automatically run performance tests with every deployment. SpeedCurve also works directly with GitHub – testing your code as part of each pull request, so your team sees performance feedback right where they work.

Automatically test the performance of Github Pull Requests

SpeedCurve Github Integration
Find, fix, and ship faster

Understand exactly where your site is slow, why it’s happening, and how to fix it – before it affects your users. We turn performance data into action. From diagnosis to deployment, your team gets the insights and confidence to build faster, more reliable websites.

5% Conversion rate increase
25% Faster hotel search
7% Conversion rate increase
Diagnose & Improve Features

Synthetic testing

Collect lab data within a controlled environment that provides advanced debugging capabilities letting you identify, isolate, and fix your performance issues.

Real user monitoring (RUM)

Collect field data that shows you how your real users experience the speed of your site.

Lighthouse scores and audits

Automated, prioritized recommendations on what to fix to improve your site’s performance.

Custom audits from web performance experts

SpeedCurve performance experts work alongside your team to uncover root causes and guide you through the fixes.

Interactive browser waterfalls

See how each request affects rendering as the page loads—making it easy to spot delays and other performance issues.

Side-by-side comparisons

Comparison views with two synthetic tests or two groups of RUM sessions that highlight what’s changed making it easy to identify problems.

CI/CD integrations

Automatically run performance tests with every deployment, preventing regressions from going live.

GitHub Integration

SpeedCurve performance testing as part of your pull request process gives you performance feedback right where your team works.

Third-party tracking

Track individual third parties over time, get visibility into their impact on your page speed, and get alerts when they violate performance SLAs.

Private test agents

Use your own private agents to test code behind firewalls or in hard-to-reach regions like China or Central America.

Unlimited user seats and teams

Expand your performance monitoring and visibility throughout your organization.

Case Studies
The Telegraph
Improving third-party web performance at The Telegraph
We use SpeedCurve and have found it invaluable to help pinpoint potential problems along the way. The dashboards they offer around JavaScript usage and third-parties remind us to keep a record of where we’ve come from and where we need to be...
Read Story
GOV.UK
Making GOV.UK pages load faster and use less data
We made a simple code change but the impact on the wider GOV.UK codebase was significant. We changed the way the `@font-face` loading method referenced fonts...
Read Story
Casper
How Casper shaved 1.7 seconds off casper.com by self-hosting Optimizely
We recently deployed a change to casper.com that loaded a piece of 3rd party JavaScript from our own server instead of the vendor’s server. This change shaved 1.7 seconds off of the start render time...
Read Story
We've helped speed up these websites